|
The LPF Gain & frequency can be varied in order to recover the sampled sinewave back. The sampling frequency is 8333.33 Hz & the sine wave has a frequency is 245.736 Hz which is more than double the maximum frequency component of sine wave. So is the verification of sampling theorem.
 |
The dominant frequency components present are at 0 Hz, 850Hz 890 Hz, etc.
The THD (Total harmonic Distortion) is 5.68% & Signal to noise ratio is 3.06 dB.
The Detected Fundamental frequency is 244.28 Hz & the Fundamental frequency power is 0.50.
 |
The dominant frequency is present but is far apart & with a Total Harmonic Distortion (THD) is 2.63% & SINAD is 23.48 dB. The Fundamental frequency is 244.14 Hz & Fundamental frequency Power is 0.26.
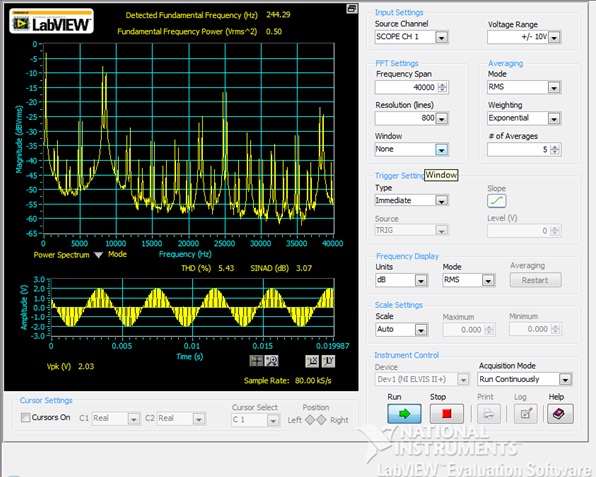 |
From the Fig.4, you can see that the scale chosen is dB scale. The THD is 5.43% & SINAD is 3.07.
 |
The Reconstructed signal has THD is 2.17% & SINAD is 23.37 dB. The signal to noise ratio of reconstructed signal is more than the sampled signal.